Vélib’ Métropole: Data Exploration, Analysis and Monitoring
Data Analytics of the Velib' Metropole service. This project was developed as part of the "Big Data Architecture" course at IP Paris.
Among another colleague, we designed a data pipeline to leverage the Velib public API, providing real-time insights into the status of Velib stations through computation of statistics and analysis.
To achieve this, we used Apache Kafka to ingest the data, Apache Spark to process it and Plotly to visualize the results. The project was developed in Scala, and the final results presented in an online dashboard.
This project was a great opportunity to gather experience in:
- Big data infrastructure.
- Apache Spark.
- Apache Kafka.
- Scala programming language.
- Data dashboards with Plotly.
Gallery
Velib stations are everywhere in Paris. Using the API we were able to get real-time analytics of the status of the stations. Here we present two tidbits of the results we obtained.

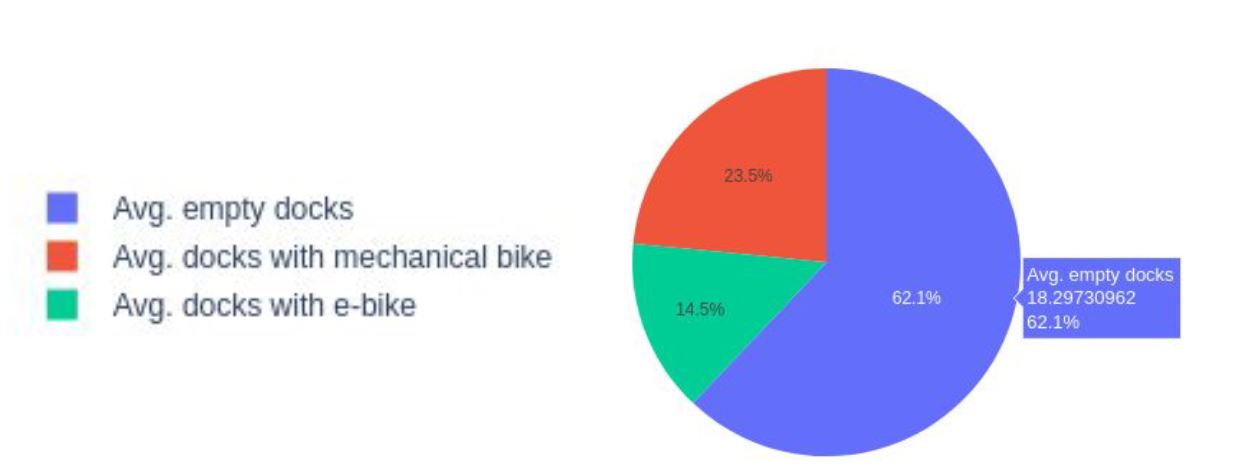
How is the average Velib station composed? We can see that the average station will have around 62% empty docks, 14% with mechanical bikes and the 23% with electric bikes.
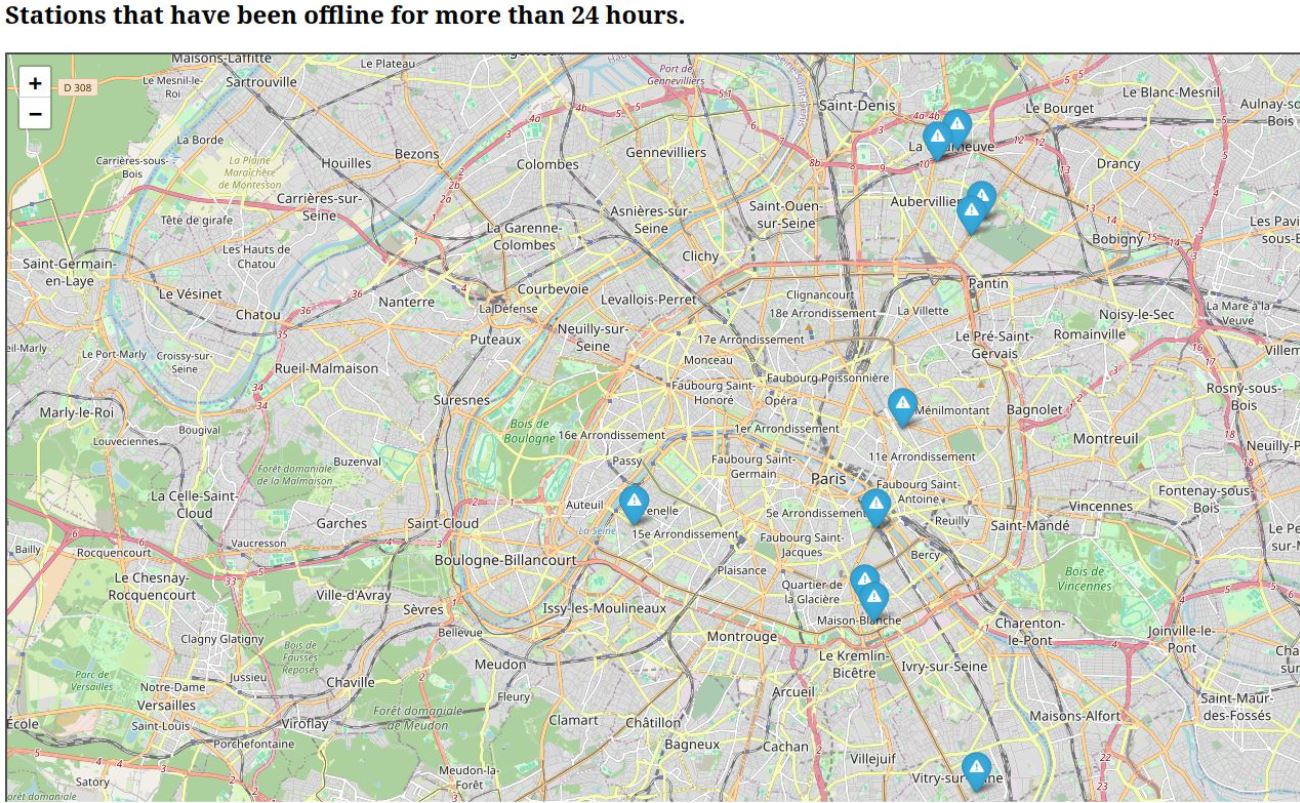
 We can also check which stations have been malfunctioning lately. In this map, we can see the stations that have been offline for more than 24 hours.